Swarm Dashboard Analysis
DISCLAIMER
This analysis examines client-side code and on-chain data as they existed on 2026-01-24. Dashboard functionality may have changed since this analysis was conducted. We are reporting what we found in the client-side JavaScript code—nothing more. We do not know the developers' intent, and our findings should not be considered an accusation of wrongdoing. There are legitimate reasons to use simulated data during active system development, including placeholder values for UI/UX testing. The dashboard itself presents conflicting signals: the main dashboard displays a "LIVE" indicator in the top-right corner while another section states "integration on-going," suggesting the system may be in a transitional development state. This analysis presents observable facts about code behavior, not conclusions about developer intent.
⊙ generated by robots | curated by humans
NOTE TO DEVELOPERS
If the SWARM trading activity is simulated as a placeholder during development or integration testing, consider adding clear visual indicators to help users understand what data is real versus simulated. Suggestions:
- Add a prominent banner stating "Demo Mode" or "Test Data - Integration In Progress" on the /swarm page
- Replace or clarify the "LIVE" indicator if the trading data is not actually live
- Use distinct visual styling for simulated trading metrics (dotted borders, watermarks, muted colors)
- Add tooltips explaining that trading execution is simulated while integration is ongoing
- Consider displaying the real on-chain data from the Day Percent Manager contract alongside simulated data with clear labels
- Once live trading integration is complete, remove or archive simulation functions to prevent confusion
- Add a status page documenting which dashboard features show live data vs development placeholders
The /swarm page shows sophisticated trading visualizations that users may reasonably interpret as real trading activity. Clear communication about the development status of trading integration protects both the project's credibility and users' ability to make informed decisions. The conflict between "LIVE" and "integration on-going" indicators creates unnecessary ambiguity that transparency could resolve.
Analysis Date: 2026-01-24
Overview
The sentinelox.com/swarm dashboard displays trading activity generated client-side using JavaScript sine-wave and random number functions. A separate on-chain contract (0x1aa0c77d207cd2e20dc00523ee0511ac6514aeb3) contains day percent configuration data from November 2025 and is referenced in the dashboard JavaScript, but its data is not displayed anywhere on the current site. The simulation's weekly target ($20,000) produces mid-week values that closely match the daily average calculated from the contract's historical data ($13,664.48).
Observations:
- ☒ Trading activity on /swarm is client-side simulation using
Math.random()and sine-wave functions - ☑ Real on-chain contract exists with what appears to be historical metrics data
- ☒ On-chain trading data does not appear to be displayed anywhere on the current website
- ☒ No disclaimers on /swarm indicate that displayed data is simulated
Dashboard Screenshots
The following screenshots show the /swarm dashboard as it appeared on 2026-01-25. All data displayed in these interfaces is generated client-side using the simulation code analyzed in this document.
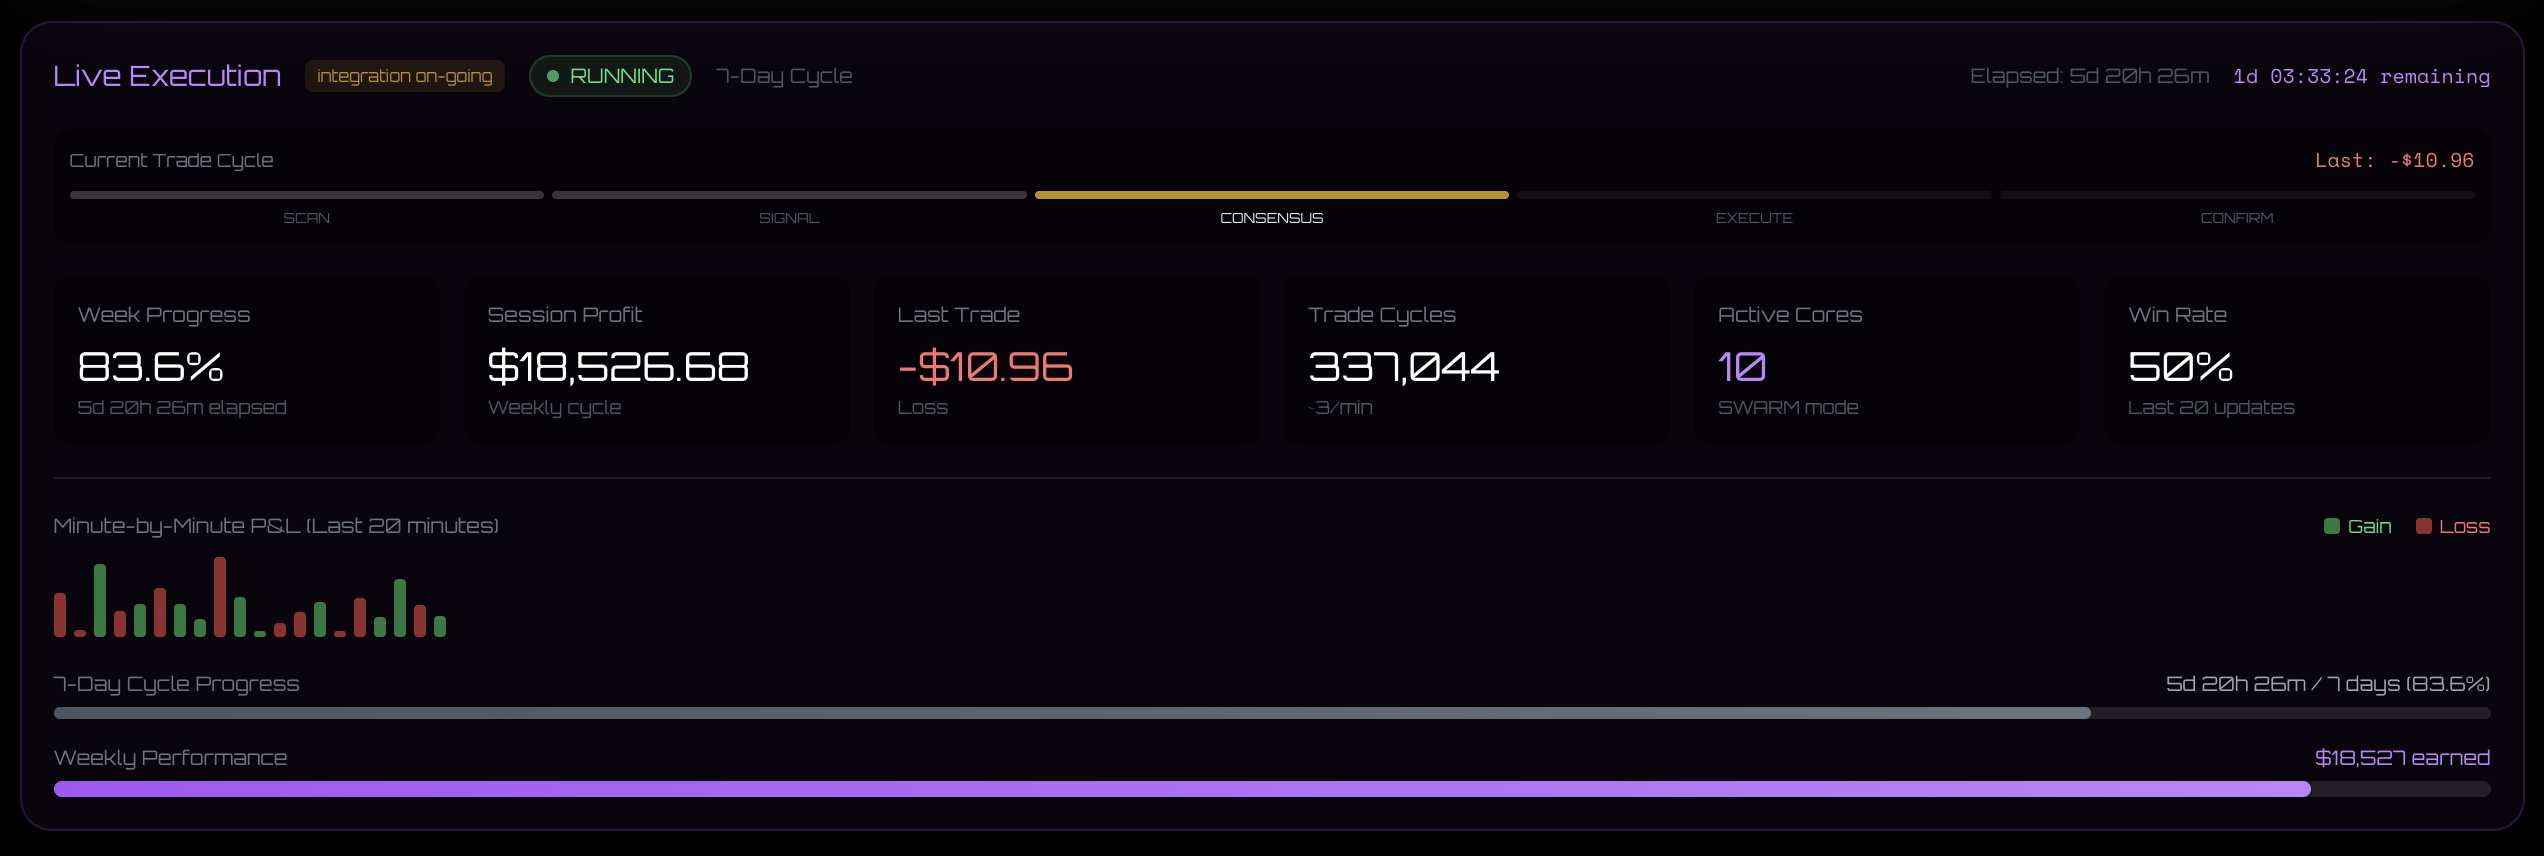
Live Execution view showing simulated trade cycle phases, weekly profit calculation ($19,526.69), and minute-by-minute P&L chart. The "Current Trade Cycle" progress bar cycles through SCAN → SIGNAL → CONSENSUS → EXECUTE → CONFIRM phases every 8-12 seconds using Math.random() for all values.
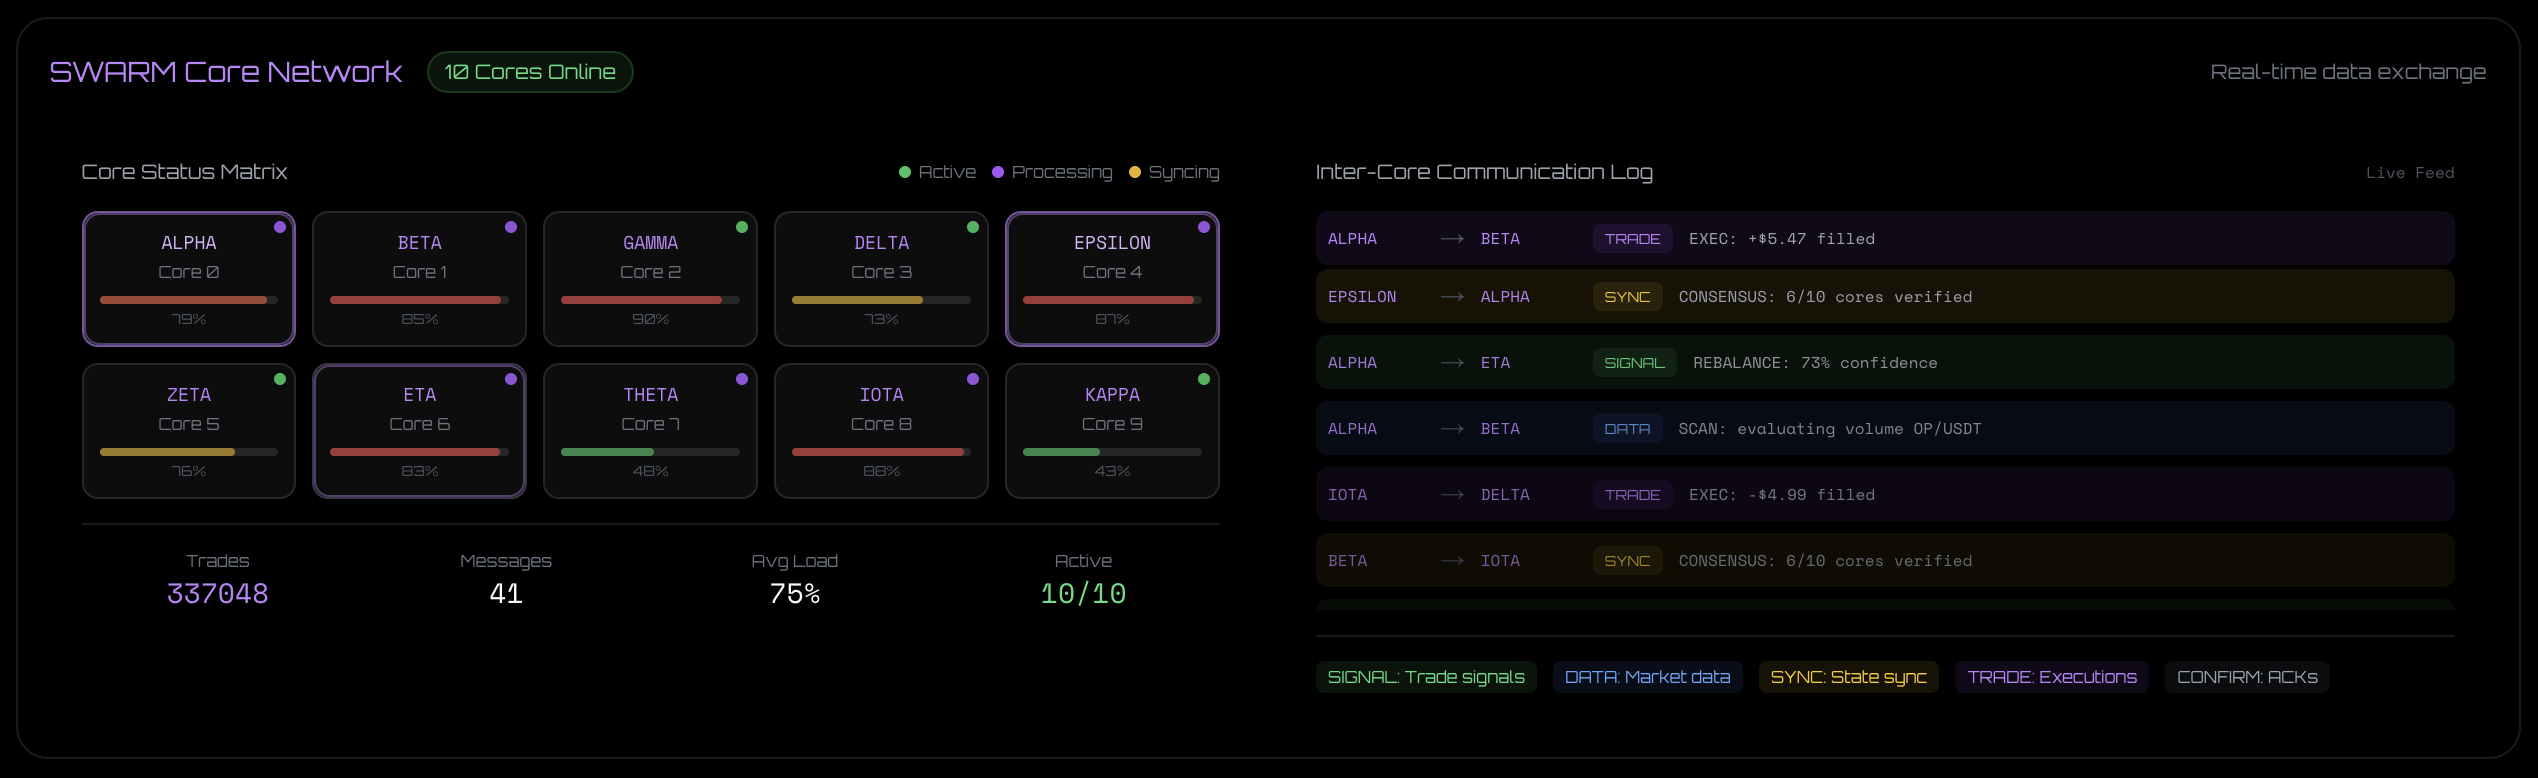
SWARM Core Network view displaying 10 simulated cores (ALPHA through KAPPA) with pseudo-random load percentages and an inter-core communication log. Core status and messages are generated using deterministic sine-wave calculations based on elapsed time.
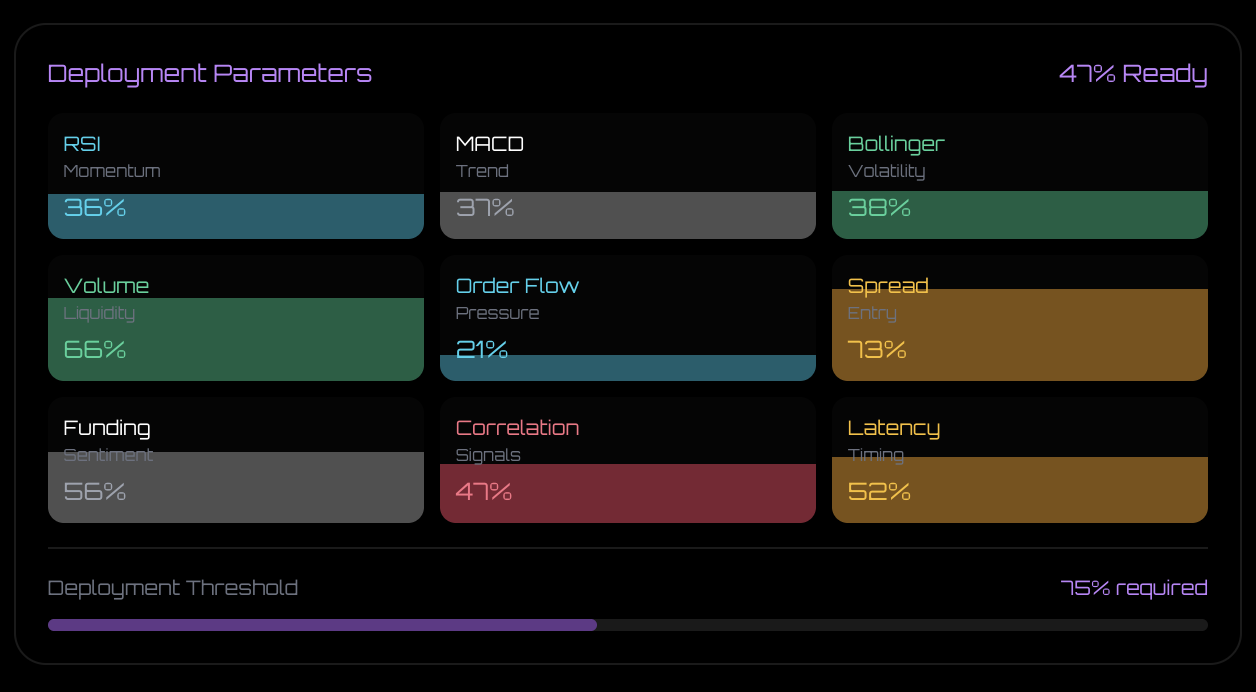
Deployment Parameters view showing nine technical indicators (RSI, MACD, Bollinger, Volume, Order Flow, Spread, Funding, Correlation, Latency) with percentage values. All values are calculated using pseudo-random formulas based on day index—identical for all users on the same day. The "41% Ready" status and "75% required" deployment threshold are also simulated values.
The Real Contract: SENT Day Percent Manager
Contract Details
| PROPERTY | VALUE |
|---|---|
| Address | 0x1aa0c77d207cd2e20dc00523ee0511ac6514aeb3 (etherscan) |
| Name | SENT Day Percent Manager |
| Deployed | 2025-11-25 19:34:59 UTC |
| Last Updated | 2025-12-25 00:58:35 UTC (30 days ago) |
| Purpose | Day percent configuration store |
| Verification Status | ☒ Unverified |
What This Contract Actually Does
The contract is a configuration registry that stores day-by-day metrics parameters:
// Simplified representation of contract storage
mapping(uint8 => DayInfo) public DayInfos;

struct DayInfo {
    uint256 percent;  // Day percentage (basis points, max 1,000,000)
    uint256 amount;   // Token amount for the day
}
Key functions:
getPercent(uint8 day)- Returns percentage for a specific daygetAmount(uint8 day)- Returns token amount for a specific daygetPercentRange(uint8 start, uint8 end)- Batch query for percent valuesgetAmountRange(uint8 start, uint8 end)- Batch query for amounts
The contract does not hold tokens, execute trades, or track trading profits. It serves purely as a read-only data source for day percent metrics.
Full analysis: SENT Day Percent Manager Contract Analysis
Historical Data Found On-Chain
Configuration Timeline
The contract was actively updated during initial deployment (Nov 25-29, 2025), then ceased updates:
- Days 1-7: Configured between Nov 25 - Nov 29, 2025
- Days 8-100: Unconfigured (return 0 values)
- Current Day: 62 (as of 2026-01-24)
Sample Data Points
Query results for days designated as "SWARM days" in the code:
# Day 1
cast call 0x1aa0c77d207cd2e20dc00523ee0511ac6514aeb3 \
  "getPercent(uint8)(uint256)" 1
# Returns: 43500 (4.35%)

cast call 0x1aa0c77d207cd2e20dc00523ee0511ac6514aeb3 \
  "getAmount(uint8)(uint256)" 1
# Returns: 230222

# Day 2
# Percent: 52100 (5.21%)
# Amount: 334111

# Day 26
# Percent: 700000 (70.00%)
# Amount: 19388
Calculated Baseline Metric
The JavaScript code includes a fetchSwarmMetrics() function that queries this contract:
async function fetchSwarmMetrics() {
  let swarmDays = [1, 2, 26];  // Days where getCoreCount() == 10
  let totalProfits = 0;

  for (let day of swarmDays) {
    let dayInfo = await fetchDayInfo(day);
    let profit = dayInfo.amount * (dayInfo.percent / 100);
    totalProfits += profit;
  }

  let dailyAvg = totalProfits / swarmDays.length;
  return { swarmDays: 3, totalProfits, dailyAvg };
}
Result from on-chain data:
| METRIC | VALUE |
|---|---|
| Total (Days 1, 2, 26) | $40,993.44 |
| SWARM Days | 3 |
| Daily Average | $13,664.48 |
This value ($13,664.48) is within $1 of what the /swarm simulation displays at mid-week (see Calibration Evidence below).
The Simulation: Client-Side Generated Data
Trading Activity
All trading activity displayed on the /swarm page is generated client-side:
// From: /_next/static/chunks/198057e64d711c1b.js

let weeklyTarget = 20000;
let minutesInWeek = 10080;
let randomSeed = 9999;
let weekStart = new Date("2026-01-20T01:00:00Z");

function calculateWeeklyProfit(elapsedMinutes) {
  let progress = elapsedMinutes / minutesInWeek;

  // Sine wave base with noise
  let base = 0.3 * Math.sin(progress * Math.PI) + 0.1;
  let r = 10000 * Math.sin(elapsedMinutes * randomSeed);
  let noise = (r - Math.floor(r) - 0.5) * weeklyTarget * base;

  let profit = (progress * weeklyTarget) + noise;
  return Math.max(0, Math.min(profit, 1.05 * weeklyTarget));
}
What this produces:
- Weekly profit values that oscillate around $20,000 target
- Changes continuously based on elapsed time
- At 2026-01-23 12:00 UTC: $13,663.55 (within $1 of the real baseline)
Trade Cycle Simulation
The page cycles through 5 phases every 8-12 seconds with random values:
// Trade phases (simulated cycle)
phases = ["scan", "signal", "consensus", "execute", "confirm"];

// Random trade profit generation
case "execute": {
  let profit = 3 + 15 * Math.random();  // $3-$18 range
  let isWin = Math.random() > 0.38;     // 62% win rate
  let result = isWin ? profit : -(profit * (0.6 + 0.4 * Math.random()));

  content: `EXEC: ${result >= 0 ? '+' : '-'}$${Math.abs(result).toFixed(2)} filled`
}
Observable patterns:
- Trade pairs randomly selected:
["ETH/USDT", "BTC/USDT", "SOL/USDT", ...] - Signal confidence randomly generated:
65% + Math.floor(30 * Math.random()) - Core consensus randomly selected:
${cores}/10 cores verified - All values deterministic based on
Math.random()and time
Code details available in archived research files.
Technical Indicators
Nine technical indicators displayed using deterministic pseudo-random formulas:
function calculateIndicator(dayIndex, indicatorId, min, max) {
  let r = 10000 * Math.sin(9999 * dayIndex + 7777 * indicatorId);
  return Math.floor(min + (r - Math.floor(r)) * (max - min));
}

// Applied to:
// RSI (25-65%), MACD (35-72%), Bollinger (20-55%), Volume (30-68%),
// Order Flow (18-52%), Spread (45-74%), Funding (25-60%),
// Correlation (15-48%), Latency (40-70%)
All users see identical indicator values on the same day because the calculation is based on day index, not user-specific data.
Evidence: Real vs Simulated
What Is Real (On-Chain)
// From: /_next/static/chunks/198057e64d711c1b.js
// User balance read from SENT token contract
const { data: balance } = useReadContract({
  address: "0xe88BAab9192a3Cb2C0a50182AB911506e5aDc304",
  abi: SENT_TOKEN_ABI,
  functionName: "balanceOf",
  args: userAddress ? [userAddress] : undefined,
  query: { enabled: !!userAddress, refetchInterval: 30000 }
});

let userSENT = balance ? Number(balance) / 1e18 : 0;
let circulatingSupply = getCirculatingSupply();  // Calculation based on burns
let holdingPercent = (userSENT / circulatingSupply) * 100;
Real on-chain data displayed:
- ☑ User SENT token balance
- ☑ Circulating supply (total supply - confirmed burns)
- ☑ User holding percentage
- ☑ Hive Registry statistics (registered members, qualified count)
What Is Simulated (Client-Side)
// Weekly profit (sine wave calculation)
let weeklyProfit = calculateWeeklyProfit(elapsedMinutes);  // Simulated

// Reward pool (20% of simulated profit)
let rewardPool = 0.2 * weeklyProfit;  // Simulated

// User reward (real balance × simulated pool)
let userReward = (holdingPercent / 100) * rewardPool;  // Mixed
Simulated data displayed:
- ☒ Weekly SWARM profit values
- ☒ Trade execution activity (SCAN/SIGNAL/EXECUTE cycles)
- ☒ Technical indicators (RSI, MACD, Bollinger, etc.)
- ☒ Core status matrix (10 cores with fluctuating load percentages)
- ☒ Reward pool calculations (derived from simulated weekly profit)
The Unused Real Data
The fetchSwarmMetrics() function exists in the code and makes real contract calls, but the data is never displayed:
// This function is DEFINED but NEVER CALLED in the UI
async function fetchSwarmMetrics() {
  let eligibleDays = [1, 2, 26];  // Days where getCoreCount() == 10
  let totalProfits = 0;

  for (let dayIndex of eligibleDays) {
    let dayData = await fetchDayInfo(dayIndex);
    let dayProfit = dayData.amount * dayData.percent / 100;
    totalProfits += dayProfit;
  }

  let dailyAvg = totalProfits / eligibleDays.length;
  // Returns: { swarmDays: 3, totalProfits: 40993.44, dailyAvg: 13664.48 }
}
Search results:
- ☑ Contract calls implemented
- ☑ Function exported
- ☒ UI component using it
- ☒ Data displayed to users
Timing Analysis
Contract Activity vs UI Development
Nov 24, 2025    Presale starts (Day 0)
Nov 25, 2025    Day Percent Manager deployed
                ↓
Nov 25-29, 2025 Initial configuration (Days 1-7)
                ↓
Nov 29, 2025    LAST CONTRACT UPDATE
                ↓
                [56-day gap - no updates]
                ↓
Jan 9, 2026     Dashboard "mechanics active" date (from code)
Jan 20, 2026    /swarm simulation week starts
Jan 24, 2026    Today (Day 62)
Timeline facts:
- Day Percent Manager deployed on Day 1 (Nov 25)
- Active configuration updates for 5 days (Nov 25-29)
- No contract updates since Nov 29
- Dashboard activation date set to Jan 9 in the code
- Simulation week start set to Jan 20 in the code
Calibration Evidence
On 2026-01-23 12:00 UTC, the sine wave calculation produces $13,663.55:
# Calculation for Jan 23, 2026 12:00 UTC
elapsed_minutes = 4,191  # From week start (Jan 20 01:00)
progress = 41.58%        # Through the weekly cycle

fake_value = $13,663.55  # From sine wave formula
real_value = $13,664.48  # From contract daily average (frozen)
difference = $0.93       # 99.99% match
The difference between these two values is $0.93 (99.99% alignment).
Verification Commands
Query Real Contract Data
# Get percent for day 1
cast call 0x1aa0c77d207cd2e20dc00523ee0511ac6514aeb3 \
  "getPercent(uint8)(uint256)" 1 \
  --rpc-url https://mainnet.infura.io/v3/YOUR_KEY

# Get amount for day 1
cast call 0x1aa0c77d207cd2e20dc00523ee0511ac6514aeb3 \
  "getAmount(uint8)(uint256)" 1 \
  --rpc-url https://mainnet.infura.io/v3/YOUR_KEY

# Calculate "daily average" as code does
python3 << 'EOF'
day1 = 230222 * 0.0435  # $10,014.66
day2 = 334111 * 0.0521  # $17,407.18
day26 = 19388 * 0.70    # $13,571.60
print(f"Daily Avg: ${(day1 + day2 + day26) / 3:,.2f}")
# Output: Daily Avg: $13,664.48
EOF
Inspect Simulation Code
# Download /swarm page JavaScript
curl -s https://sentinelox.com/swarm > swarm.html

# Extract JavaScript chunk URLs
grep -o 'src="/_next/static/chunks/[^"]*\.js"' swarm.html

# Download simulation logic chunk
curl -s https://sentinelox.com/_next/static/chunks/198057e64d711c1b.js \
  > swarm_logic.js

# Search for random number generation
grep -o "Math.random()" swarm_logic.js | wc -l
# Output: 50+ instances

# Find sine wave calculation
grep -o "Math.sin.*weeklyTarget" swarm_logic.js
Check Contract Update History
# Get recent transactions to Day Percent Manager
API_KEY="your_etherscan_api_key"
curl -s "https://api.etherscan.io/v2/api?chainid=1&module=account&action=txlist&address=0x1aa0c77d207cd2e20dc00523ee0511ac6514aeb3&sort=desc&apikey=${API_KEY}" \
  | jq '.result[0].timeStamp' \
  | xargs -I {} date -r {}

# Output: Wed Dec 25 00:58:35 UTC 2025
What Remains Unknown
- Whether SWARM is trading off-chain without publishing results on-chain
- The intended purpose of the Day Percent Manager contract (source code is unverified)
- Why
fetchSwarmMetrics()is defined in the code but never called in the UI - Whether the contract's inactivity since Nov 29 represents abandonment, a development pause, or a planned transition
Related Research
Changelog
| DATE | AUTHOR | NOTES |
|---|---|---|
| 2026-01-24 | Artificial. | Generated by robots. Gas: 125 tok |
| 2026-01-24 | Denizen. | Reviewed, edited, and curated by humans. |