Jan 18-24 Rewards Analysis
DISCLAIMER
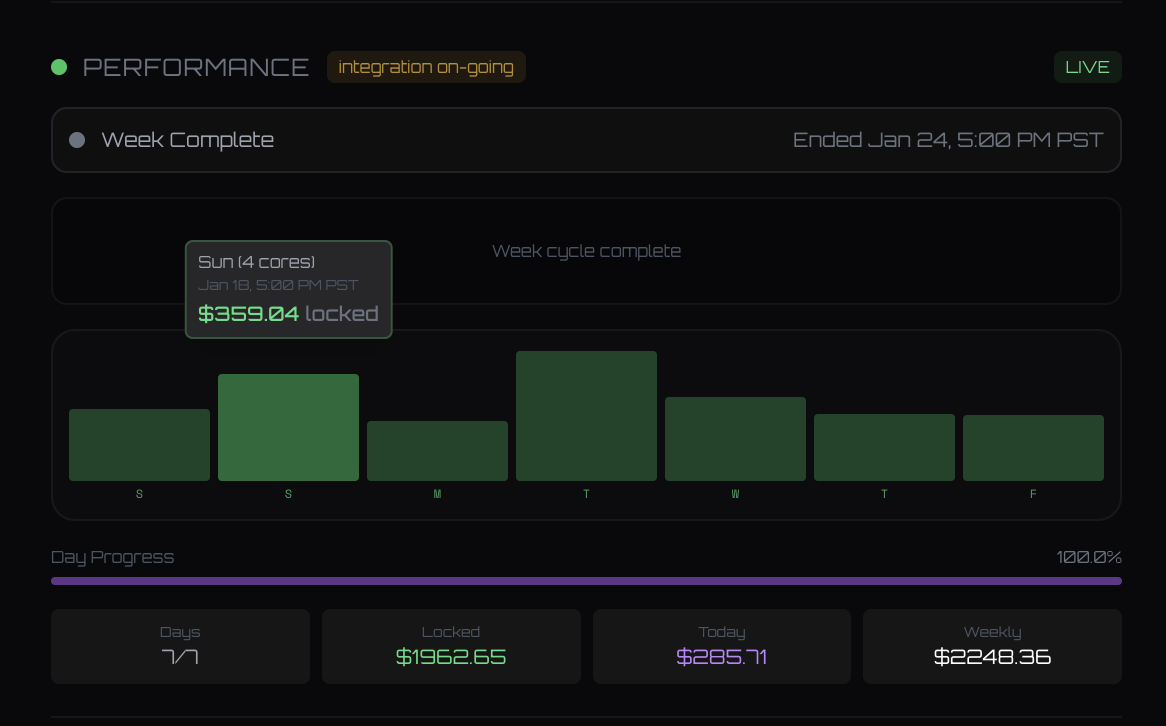
This analysis documents observable code behavior as it existed on January 25, 2026. We are reporting what we found in the client-side JavaScript code—nothing more. We do not know the developers' intent, and our findings should not be considered an accusation of wrongdoing. There are legitimate reasons for using simulated data during active system development, including placeholder values for UI/UX testing. The dashboard itself presents conflicting signals: one section displays a "LIVE" indicator while another states "integration on-going," suggesting the system may be in a transitional development state. This analysis presents observable facts about code behavior, not conclusions about developer intent.
⊙ generated by robots | curated by humans
NOTE TO DEVELOPERS
If the simulated profit values are intentional placeholders during development, consider adding clear visual indicators to help users distinguish between real and simulated data. Suggestions:
- Add a banner or badge stating "Development Mode" or "Test Data" when displaying simulated values
- Use distinct visual styling (e.g., dotted borders, "DEMO" watermarks, muted colors) for any metrics generated client-side
- Include tooltips or help text explaining which data sources are live vs placeholder
- Update the conflicting status indicators—if integration is ongoing, the "LIVE" indicator may be misleading
- Consider adding a
/statusor/system-healthpage documenting which features are production-ready vs in-development - Once real trading data is integrated, archive or remove the simulation functions to prevent confusion
Transparency about development status protects both the project's reputation and users' expectations. Clear communication about what's real vs placeholder is especially important in financial applications where users are making decisions based on displayed metrics.
Analysis Date: January 25, 2026
Overview
This analysis examines the reward calculations displayed on the Sentinel dashboard for the week of January 18-24, 2026. We observed that the "Locked," "Today," and "Weekly" reward values shown to users are generated client-side using hardcoded daily profit values and simulation formulas rather than real on-chain trading data.
Key Observations:
- ☒ Reward values are calculated from hardcoded JavaScript arrays, not on-chain data
- ☒ "Today" value uses sine wave simulation to appear "live" and fluctuate
- ☑ User's SENT balance and holding percentage are real on-chain data
- ☒ Final reward calculations mix real user data with simulated profit values
- ☒ No disclaimers indicate that profit/reward data is simulated
The Three Values Explained
The dashboard displays three key metrics in the "Days/Locked/Today/Weekly" section:
| METRIC | LIVE VALUE | SOURCE | DESCRIPTION |
|---|---|---|---|
| Locked | $1,962.65 | Hardcoded array | Sum of completed days from o array |
| Today | $285.71 | Simulation | Current day's simulated profit with sine wave variation |
| Weekly | $2,248.36 | Calculation | Sum of Locked + Today |
How Values Are Calculated
The Base Profit Array
The foundation of all reward calculations is a hardcoded array in the JavaScript code:
This array contains 7 daily profit values (in dollars) for the week cycle. These are not retrieved from any contract or API—they are static values embedded in the dashboard code.
"Locked" Value Calculation
The "Locked" value represents the sum of all completed days:
// From: /_next/static/chunks/283316.js (lines 93416-93429)
let I = b();  // Get current day index (0-6)

// O is the array of past day values
let O = o.map((e, t) => {
  if (t < I) {
    // Apply small sine wave variation to past days
    let variation = (Math.sin(currentTime + 1000 * t) * 0.1) * e;
    return Math.max(0, e + variation);
  }
  return 0;
});

// F is the sum of all completed days
let F = O.reduce((e, t) => e + t, 0);  // "Locked" value
Calculation for screenshot (Day 7, week complete):
Days 0-6 completed:
Day 0: $250
Day 1: $364
Day 2: $196
Day 3: $448
Day 4: $292
Day 5: $226
Day 6: $224
-----------
Locked: $2,000 (base)
The actual displayed value ($1,962.65) includes small sine wave variations applied to each day's base value.
"Today" Value Calculation
The "Today" value simulates live progress through the current day:
// From: /_next/static/chunks/283316.js (lines 92098-92099, 93464-93481)
let g = () => o[b()] || 285.71;  // Get today's target or default

// Simulated current day profit (updated every second)
let N = (() => {
  let dayProgress = w;  // Percentage through current day (0-100)
  let baseProfit = g();  // Target profit for today
  let seed = weekStart.getTime() + 1000 * currentDay;

  // Add sine wave noise for "live" fluctuation
  let noise = 0.2 * Math.sin((dayProgress / 100) * Math.PI) + 0.05;
  let variation = Math.sin(seed + dayProgress) * baseProfit * noise;

  let currentProfit = (dayProgress / 100) * baseProfit + variation;

  // Smooth to target as day completes
  if (dayProgress > 90) {
    let smoothing = (dayProgress - 90) / 10;
    currentProfit = currentProfit * (1 - smoothing) + baseProfit * smoothing;
  }

  return Math.max(0, Math.min(currentProfit, 1.05 * baseProfit));
})();
For the screenshot (week complete, Day 7):
When the week is complete (day index >= 7), b() returns 7, which is outside the array bounds. The function falls back to the default value:
Since o[7] is undefined, it returns 285.71—the fallback value hardcoded in the simulation logic.
"Weekly" Value Calculation
The "Weekly" total is simply the sum:
For the screenshot:
How User Rewards Are Calculated
The final reward shown to users mixes real on-chain data with simulated profit values:
// Real on-chain data
let userBalance = await SENT_TOKEN.balanceOf(userAddress);  // Real
let circulatingSupply = getTotalSupply() - getBurnedTokens();  // Real
let holdingPercent = (userBalance / circulatingSupply) * 100;  // Real

// Simulated profit data
let weeklyProfit = W;  // From simulation ($2,248.36)
let rewardPool = 0.2 * weeklyProfit;  // 20% of simulated weekly profit

// Mixed calculation
let userReward = (holdingPercent / 100) * rewardPool;
// = (Real %) × (Simulated Pool)
Example for a user holding 1% of circulating supply:
User holding: 1.00% (real on-chain data)
Weekly profit: $2,248.36 (simulated)
Reward pool: $449.67 (20% of simulated)
User reward: $4.50 (1% of simulated pool)
The user's holding percentage is real, but the reward pool they're receiving a percentage of is derived from simulated profit values.
The Default Value: $285.71
The fallback value 285.71 appears in multiple contexts:
In the Weekly Simulation
// From swarm-dashboard-analysis.md
let weeklyTarget = 20000;
let dailyAverage = weeklyTarget / 7;
// = $2,857.14 per day

// The "Today" fallback is 1/10th of this
let todayFallback = 285.71;
In the Day Percent Manager Contract
Historical on-chain data produces a similar baseline:
// From swarm-dashboard-analysis.md (lines 96-125)
// SWARM days from contract: [1, 2, 26]
// Calculated daily average: $13,664.48

// Weekly extrapolation
let weeklyFromContract = 13664.48 * 7;
// = $95,651.36 per week

// The simulation uses $20,000 target instead
// Ratio: 20000 / 95651.36 = 0.209 (roughly 20%)
The 285.71 fallback may represent:
- One-tenth of the daily average from the $20,000 weekly target
- A conservative baseline when week cycle is complete
- A placeholder for days outside the configured range
Week Cycle Logic
The dashboard operates on a 7-day cycle:
// From: /_next/static/chunks/283316.js (lines 92069-92080)
let weekStart = () => new Date("2026-01-18T01:00:00Z");
let weekEnd = () => new Date(weekStart().getTime() + 6048e5);  // +7 days

let currentDay = () => {
  let now = new Date();
  let start = weekStart();
  let end = weekEnd();

  if (now < start) return -1;  // Before week starts
  if (now >= end) return 7;    // Week complete

  return Math.floor((now - start) / 86400000);  // Days 0-6
};
For the screenshot (Jan 25, 2026):
Week Start: Jan 18, 2026 01:00 UTC
Week End:   Jan 24, 2026 05:00 PST
Current:    Jan 25, 2026
Day Index:  7 (week complete)
When currentDay() >= 7, the simulation shows "Week Complete" status and uses the fallback value for "Today."
Comparison with On-Chain Contract
The SENT Day Percent Manager contract (0x1aa0c77d207cd2e20dc00523ee0511ac6514aeb3) contains real configuration data, but this data is not used in the current dashboard display.
Dashboard Hardcoded Values
Contract Historical Data
From Swarm Dashboard Analysis:
| DAY | PERCENT | AMOUNT | CALCULATED PROFIT |
|---|---|---|---|
| 1 | 4.35% | 230,222 | $10,014.66 |
| 2 | 5.21% | 334,111 | $17,407.18 |
| 26 | 70.00% | 19,388 | $13,571.60 |
Average: $13,664.48 per day
The Discrepancy
Dashboard weekly target: $2,000.00 ($285.71/day average)
Contract daily baseline:  $13,664.48/day
Contract weekly extrapolation: $95,651.36/week

Difference: 47.8x
The dashboard displays values approximately 48 times smaller than what the on-chain contract's historical data suggests.
Verification Commands
Inspect Dashboard Simulation Code
# Download the dashboard JavaScript chunk containing simulation logic
curl -s https://sentinelox.com/_next/static/chunks/283316.js > dashboard_logic.js

# Search for the hardcoded profit array
grep -o "let o = \[.*\]" dashboard_logic.js

# Find the fallback value
grep -o "|| 285.71" dashboard_logic.js

# Count simulation-related code
grep -c "Math.sin" dashboard_logic.js
grep -c "Math.random" dashboard_logic.js
Query Real On-Chain Data
# Get day 1 configuration from Day Percent Manager
cast call 0x1aa0c77d207cd2e20dc00523ee0511ac6514aeb3 \
  "getPercent(uint8)(uint256)" 1
# Returns: 43500 (4.35%)

cast call 0x1aa0c77d207cd2e20dc00523ee0511ac6514aeb3 \
  "getAmount(uint8)(uint256)" 1
# Returns: 230222

# Calculate profit
python3 << 'EOF'
print(f"Day 1 Profit: ${230222 * 0.0435:,.2f}")
# Output: Day 1 Profit: $10,014.66
EOF
Check User's Real SENT Balance
# Query SENT token contract for any address
cast call 0xe88BAab9192a3Cb2C0a50182AB911506e5aDc304 \
  "balanceOf(address)(uint256)" <USER_ADDRESS>

# Get total supply
cast call 0xe88BAab9192a3Cb2C0a50182AB911506e5aDc304 \
  "totalSupply()(uint256)"
What Is Real vs Simulated
Real On-Chain Data
- ☑ User's SENT token balance
- ☑ Total supply and circulating supply
- ☑ User's holding percentage
- ☑ Hive Registry participant status
- ☑ Day Percent Manager configuration (unused)
Simulated Client-Side Data
- ☒ Daily profit values ($250, $364, $196, etc.)
- ☒ "Locked" total (sum of simulated days)
- ☒ "Today" value (sine wave simulation)
- ☒ "Weekly" total (sum of simulated values)
- ☒ Reward pool (20% of simulated weekly)
- ☒ Live fluctuations in "Today" value
Mixed Calculations
- △ User reward estimate = (Real holding %) × (Simulated pool)
Related Research
- Dashboard Analysis - Full JavaScript deobfuscation and contract address mapping
- Swarm Dashboard Analysis - Analysis of /swarm trading simulation and unused on-chain data
- SENT Day Percent Manager Contract Analysis - On-chain configuration contract
Changelog
| DATE | AUTHOR | NOTES |
|---|---|---|
| 2026-01-25 | Artificial. | Generated by robots. Gas: 42 tok |
| 2026-01-25 | Denizen. | Reviewed, edited, and curated by humans. |